Here at Ice Moon Prison, we are blessed with an ADSL2+ lifeline to the Internet. At the same time, we are cursed with degrading copper and have seen a gradual decline in our sync speeds over the last two years. To monitor the situation, and to provide ammunition to use when technicians doubt our sincerity, we have created Nagios scripts to collect statistics continuously.
Ice Moon Prison’s ADSL modem is a Netcomm NB6 rev2. Before that we used a TP-Link TD-8810 with almost exactly the same configuration. These modems have a Telnet interface through which you can get line statistics:
$ telnet 192.168.1.1
Trying 192.168.1.1...
Connected to 192.168.1.1.
Escape character is '^]'.
NetComm ADSL2+ Router NB6_REV2_16M
Software Version: 3.65m
Login name: admin
Password:
> adsl info --show
adsl: ADSL driver and PHY status
Status: ShowtimeRetrain Reason: 8000
  Channel: FAST, Upstream rate = 386 Kbps, Downstream rate = 1878 Kbps
Link Power State: L0
Mode:                   ADSL2
Channel:                Fast
Trellis:                U:ON /D:ON
Line Status:            No Defect
Training Status:        Showtime
                Down            Up
SNR (dB):       13.1            12.0
Attn(dB):       33.0            27.9
Pwr(dBm):       17.3            12.6
Max(Kbps):      2548            430
Rate (Kbps):    1878            386
                        G.dmt framing
K:              59(0)           12
R:              16              16
S:              4               16
D:              16              2
                        ADSL2 framing
MSGc:           59              11
B:              58              11
M:              4               16
T:              1               4
R:              16              16
S:              3.9529          15.5514
L:              510             107
D:              16              2
                        Counters
SF:             11813593                11857063
SFErr:          109             116
RS:             191970900               1511603
RSCorr:         25122           112
RSUnCorr:       535             0

HEC:            86              23047018
OCD:            0               0
LCD:            0               0
Total Cells:    840323492               1467251070
Data Cells:     38927716                1652798551
Drop Cells:     0
Bit Errors:     0               2211174114

ES:             852             17027110
SES:            79              8274
UAS:            1825            520066
AS:             189713

INP:            2.00            1.19
PER:            16.05           16.52
delay:          15.81           7.77
OR:             32.38           8.23

Bitswap:        1062            81
We have no idea what most of that means, but among the numbers is the downstream bitrate. Today is not a good day, with a downstream rate of only 1878 kbps.
Having to telnet into the modem to get these numbers is tedious, so we instead wrote a Perl script to do the telnetting for us. This script uses Perl’s Expect library to initiate a Telnet session and “type” commands into it. The script runs forever (or until you send it a SIGINT), keeping the Telnet session open. To make it run the adsl info --show command, send the process a SIGUSR1 signal.
$ cat /opt/local/libexec/nagios/adsl-stats.pl
#!/usr/bin/perl -w

END {
  unlink '/opt/local/var/nagios/adsl-stats.pid';
}

use Expect;

$e = Expect->new();

$e->debug(0);
$e->log_stdout(0);

# Start Telnet session.
$e->spawn("telnet 192.168.1.1");

# Log in.
$e->expect(
  5,
  [ 'ogin',
    sub {$self = shift; $self->send("admin\n"); exp_continue;} ],
  [ 'Password:',
    sub {$self = shift; $self->send("P@ssw0rd\n"); exp_continue;} ],
  '> '
);

$logout = 0;
$SIG{INT} = sub { $logout = 1; };
@command = ();
$SIG{USR1} = sub { push @command, 'show'; };
$SIG{USR2} = sub { push @command, 'SNR'; };  # To do.

# Repeat until told to exit.
while (!$logout)
{
  if (!@command)
  {
    sleep 1; next;
  }
  $command = shift @command;
  if ($command eq 'show')
  {
    # Basic ADSL info.
    $e->send("adsl info --show\n");
    $e->expect(5, "> ");
    my $result = $e->before();
    if ($result)
    {
      adslinfoshow($result);
    }
    else
    {
      last;
    }
  }
}

$e->send("logout\n");

sub adslinfoshow
{
  my $status = "";
  my $performance = "";
  my $returncode = 3;
  foreach (split(/\n/, $_[0]))
  {
    s/\r$//;
    /^Status: (G\.994 Training)/i and do { $status .= "$1 "; $returncode = 1; next; };
    /^Status: (G\.992 Started)/i and do { $status .= "$1 "; $returncode = 1; next; };
    /^Status: (G\.992 Channel Analysis)/i and do { $status .= "$1 "; $returncode = 1; next; };
    /^Status: (G\.992 Message Exchange)/i and do { $status .= "$1 "; $returncode = 1; next; };
    /^Status: (Idle)/i and do { $status .= "$1 "; $returncode = 2; next; };
    /^Mode:\s+(.*)$/i and do { $status .= "$1 "; next; };
    /^Channel:\s+(.*)$/i and do { $status .= "$1 "; next; };
    /^Line Status:\s+(.*)$/i and
      do { $status .= "$1 "; next; };
    /^Training Status:\s+(.*)$/i and
      do { $status .= "$1 ";
           $1 eq "Showtime" and $returncode = 0;
           next; };
    /^SNR\s?\(dB\):\s+(.+?)\s+(.+?)$/ and
      do { $performance .= "'snr-down'=$1dB 'snr-up'=$2dB "; next; };
    /^Attn\s?\(dB\):\s+(.+?)\s+(.+?)$/ and
      do { $performance .= "'atten-down'=$1dB 'atten-up'=$2dB "; next; };
    /^Pwr\s?\(dBm\):\s+(.+?)\s+(.+?)$/ and
      do { $performance .= "'power-down'=$1dB 'power-up'=$2dB "; next; };
    /^Max\s?\(Kbps\):\s+(.+?)\s+(.+?)$/ and
      do { $performance .= "'maxrate-down'=$1kbps 'maxrate-up'=$2kbps "; next; };
    /^Rate\s?\(Kbps\):\s+(.+?)\s+(.+?)$/ and
      do { $status .= "$1/$2kbps ";
           $performance .= "'rate-down'=$1kbps 'rate-up'=$2kbps "; next; };
  }
  my $timestamp = time;
  print "[$timestamp] PROCESS_SERVICE_CHECK_RESULT;adslmodem;ADSL sync;$returncode;$status|$performance\n";
}
The above Perl script is intended to be run from a shell script wrapper that makes the Perl script work more like a daemon, and sends the Perl script’s output to a useful place:
$ cat /opt/local/libexec/nagios/check_adsl_state
#!/bin/sh

if [ -f /opt/local/var/nagios/adsl-stats.pid ]
then
  kill -0 `cat /opt/local/var/nagios/adsl-stats.pid` || /bin/rm /opt/local/var/nagios/adsl-stats.pid
fi

if [ ! -f /opt/local/var/nagios/adsl-stats.pid ]
then
  /usr/bin/perl /opt/local/libexec/nagios/adsl-stats.pl > /opt/local/var/nagios/rw/nagios.cmd &
  echo $! > /opt/local/var/nagios/adsl-stats.pid
  sleep 2
fi

if [ -f /opt/local/var/nagios/adsl-stats.pid ]
then
  kill -USR1 `cat /opt/local/var/nagios/adsl-stats.pid`
fi
In turn, a Cron job ensures that the daemon is running, and that it probes the ADSL modem for statistics once a minute:
$ crontab -l
* * * * * /opt/local/libexec/nagios/check_adsl_state
With all this in place, the file /opt/local/var/nagios/rw/nagios.cmd is filled with lines like this:
[1374099781] PROCESS_SERVICE_CHECK_RESULT;adslmodem;ADSL sync;0;ADSL2 Fast No Defect Showtime 1878/386kbps |'snr-down'=13.1dB 'snr-up'=12.0dB 'atten-down'=33.0dB 'atten-up'=27.9dB 'power-down'=17.4dB 'power-up'=12.6dB 'maxrate-down'=2532kbps 'maxrate-up'=430kbps 'rate-down'=1878kbps 'rate-up'=386kbps
[1374099841] PROCESS_SERVICE_CHECK_RESULT;adslmodem;ADSL sync;0;ADSL2 Fast No Defect Showtime 1878/386kbps |'snr-down'=13.1dB 'snr-up'=12.0dB 'atten-down'=33.0dB 'atten-up'=27.9dB 'power-down'=17.4dB 'power-up'=12.6dB 'maxrate-down'=2572kbps 'maxrate-up'=430kbps 'rate-down'=1878kbps 'rate-up'=386kbps
This format is dictated by the Nagios passive check feature. Passive checks are useful when you have an external process that periodically dumps information to your Nagios instance. In this case, that external process is the Perl script. The file /opt/local/var/nagios/rw/nagios.cmd is monitored and periodically flushed by Nagios, and each line updates the state of a monitored service.
The Nagios host configuration for the ADSL modem accepts passive checks, and if there hasn’t been an update in 5 minutes, flips the state to UNKNOWN (3) to prevent stale information:
define host {
  use          generic-switch
  host_name    adslmodem
  alias        adslmodem
  address      192.168.1.1
}

define command {
  command_name check_adslmodem
  command_line $USER1$/check_dummy 3
}

define service {
  use local-service,graphed-service
  host_name adslmodem
  service_description ADSL sync
  check_command check_adslmodem
  active_checks_enabled 0
  passive_checks_enabled 1
  check_freshness 1
  freshness_threshold 300
}
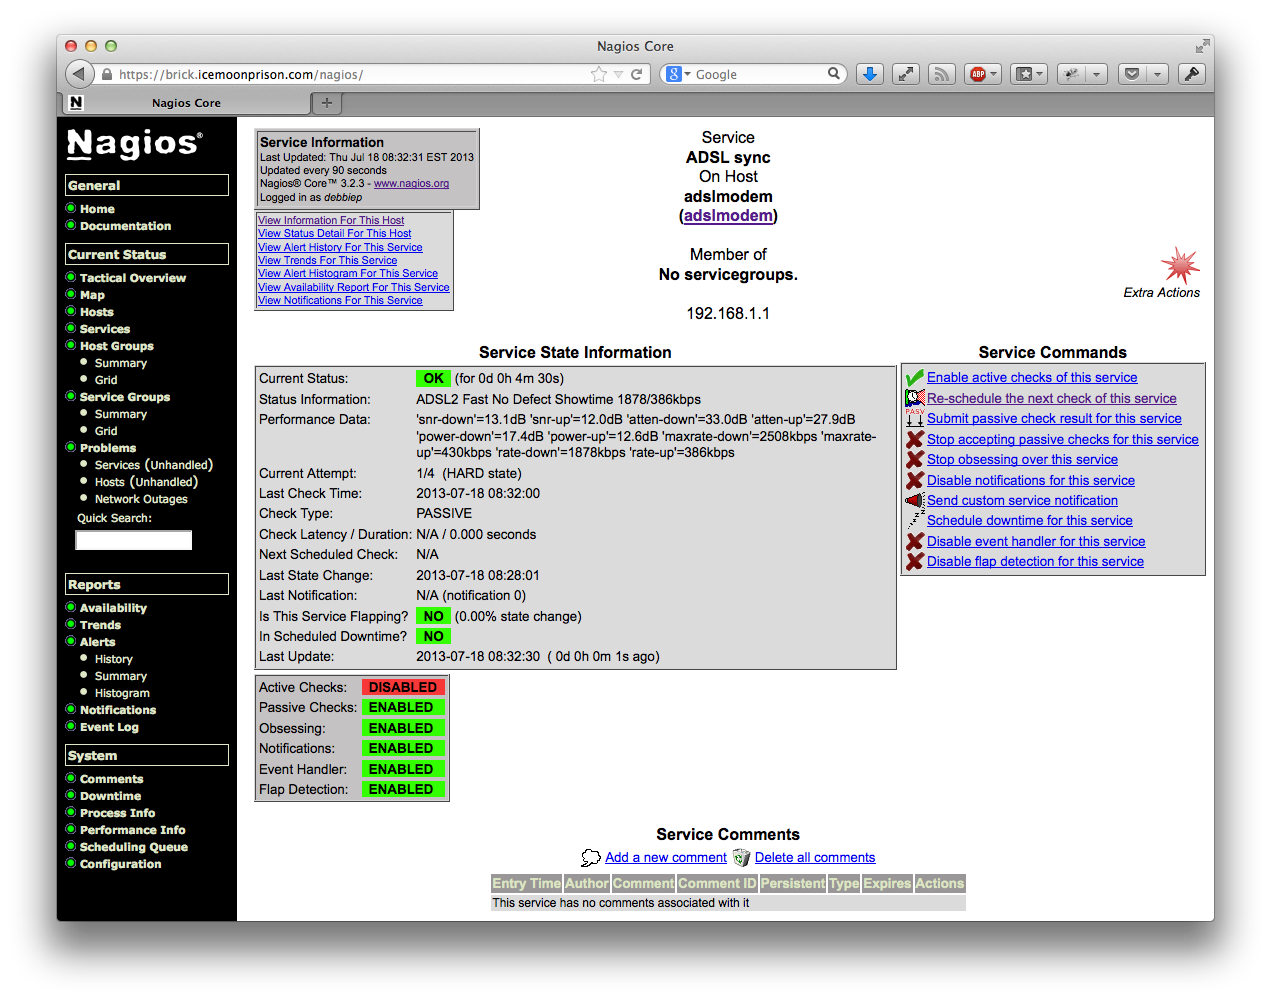
On the Nagios web page, the statistics are visible in the Performance Data:
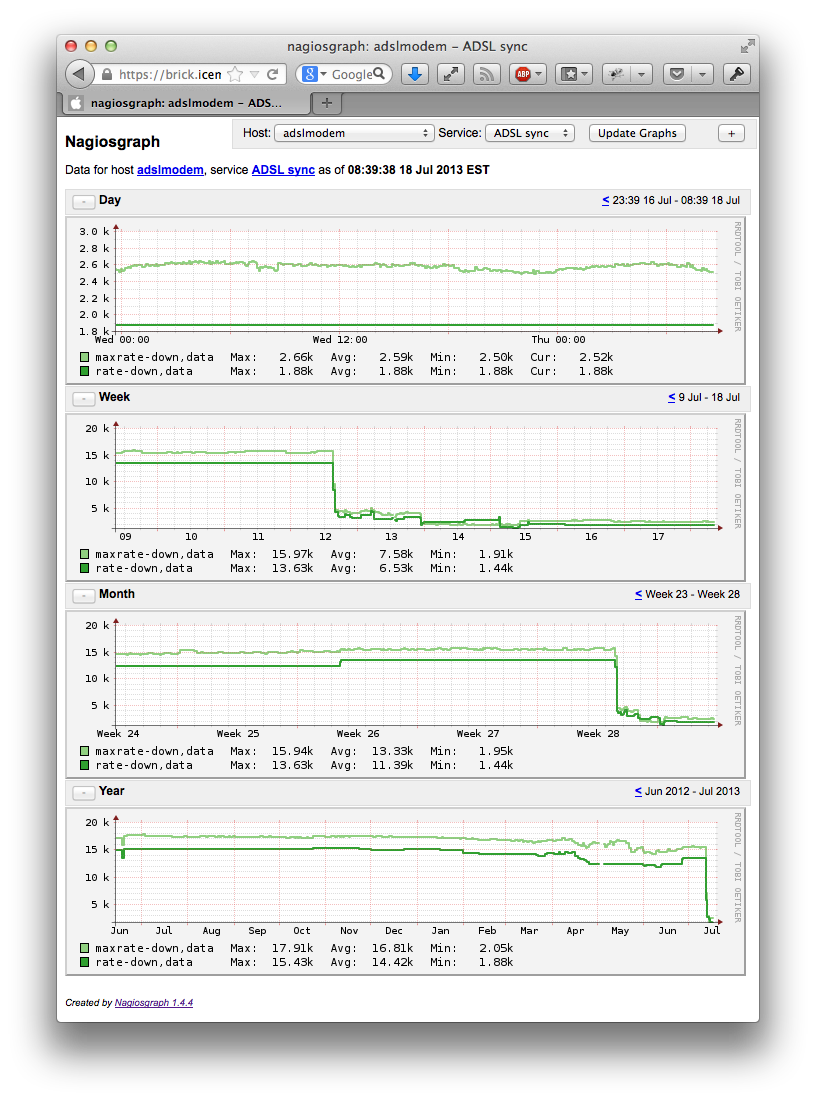
Graphing the statistics seemed like an obvious next step. Ice Moon Prison uses nagiosgraph, which collects performance data and displays it in four simple line graphs showing, from top to bottom, the statistics for the last day, week, month and year. The graph of downstream rate (maximum and actual) shows that although the line has been stable (but poor) today, for the last week the rate has danced around frequently, with each jump in the rate corresponding to a renegotiation by the ADSL modem and an interruption of any connection that was open at the time. Over the last year there has been a slow but noticeable drop in the rate that could be attained. And on the 12th of this month, something very bad happened.
Today, Ice Moon Prison has to keep staff on-site while a technician comes to diagnose the copper line. We will be showing the technician these graphs to dispel any notion in their mind that Ice Moon Prison is imagining things.
UPDATE: A week later, Telstra agreed that there was enough line noise to warrant connecting Ice Moon Prison to a different copper pair. This resolved the problem instantly.
Leave a Reply